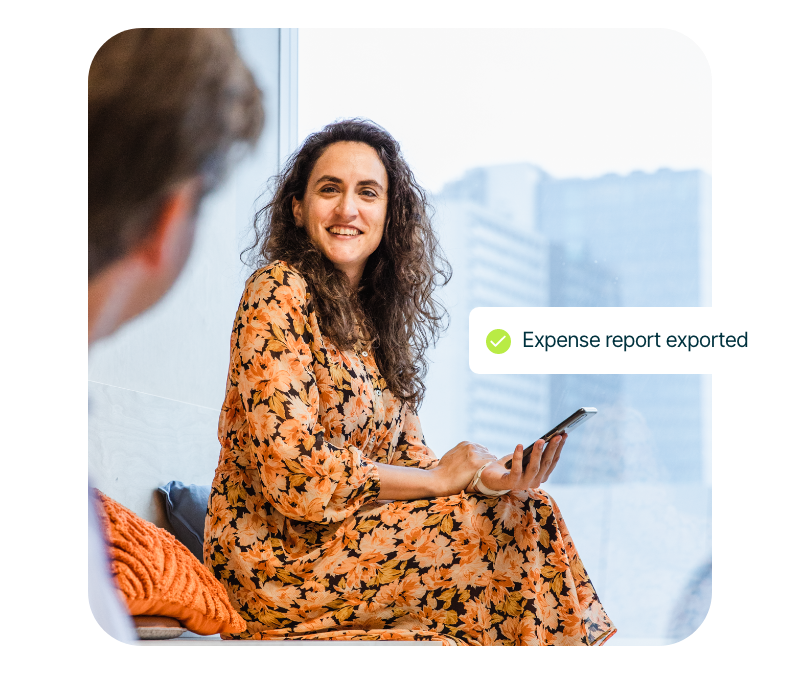
Benefit from detailed expense reporting data for smarter decisions
Empower your team with a user-friendly overview of expense data, gain back financial control and dive into key metrics more easily.

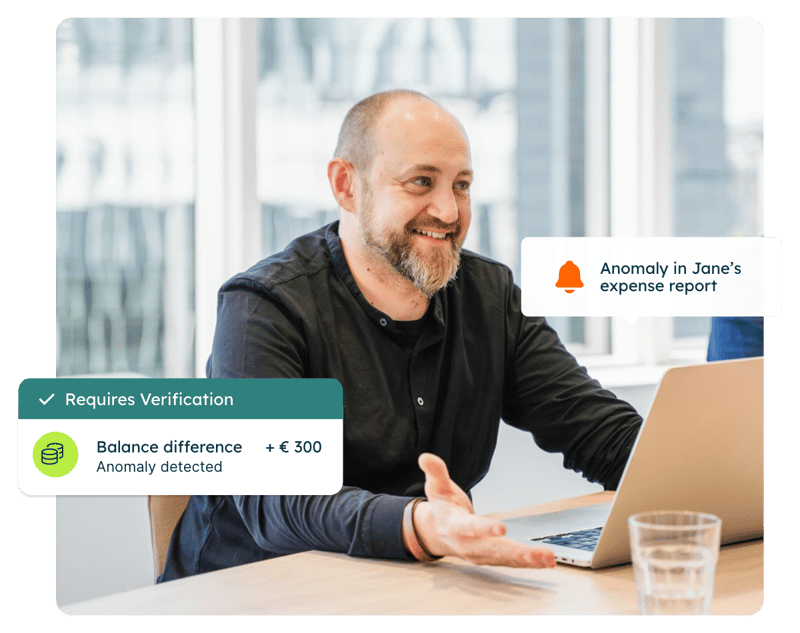


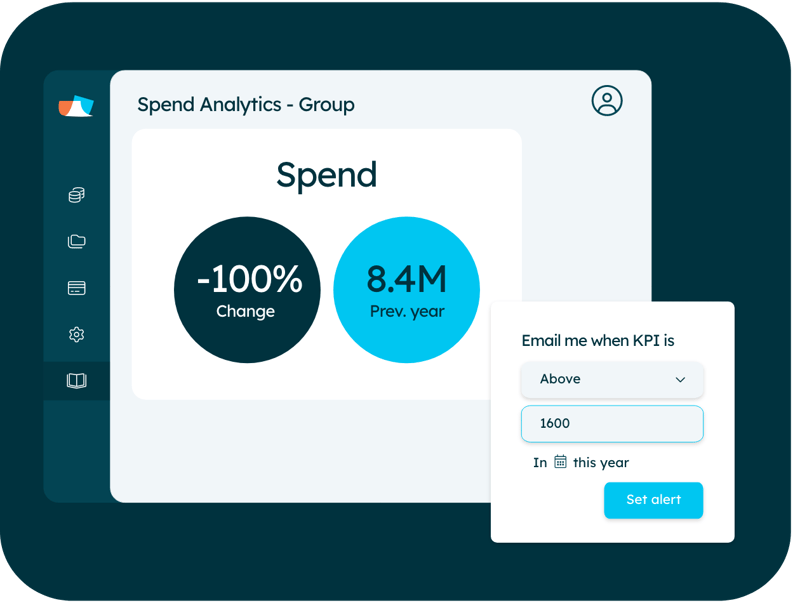
Identify overspending with automated alerts
Receive email alerts from detected excess spending. Identify top spenders, spending trends and irregularities across regions with interactive maps and visual cues.
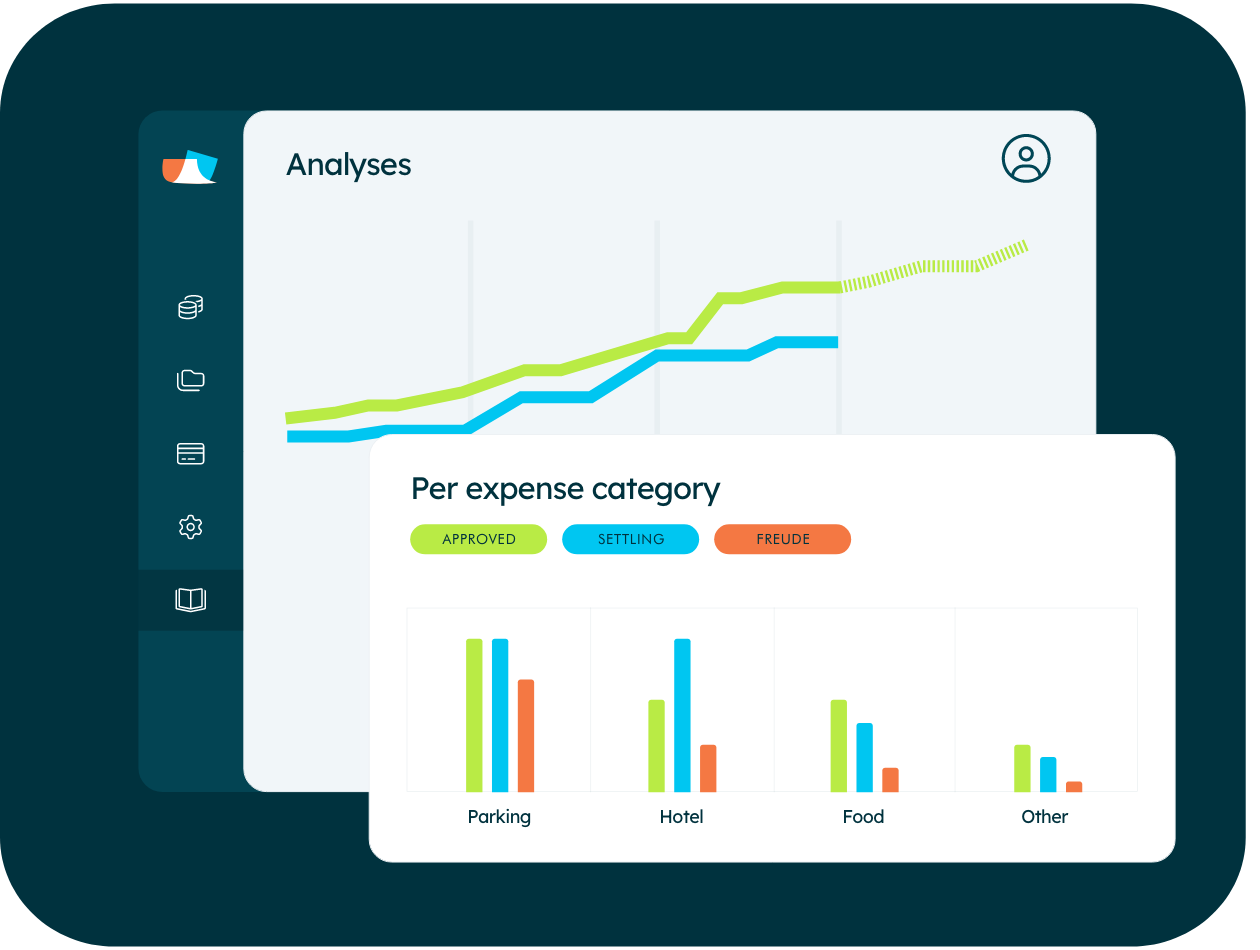
Discover cost-saving opportunities
Identify policy non-compliance or renegotiate contracts with high-spending merchants with pre-built or customised dashboards.
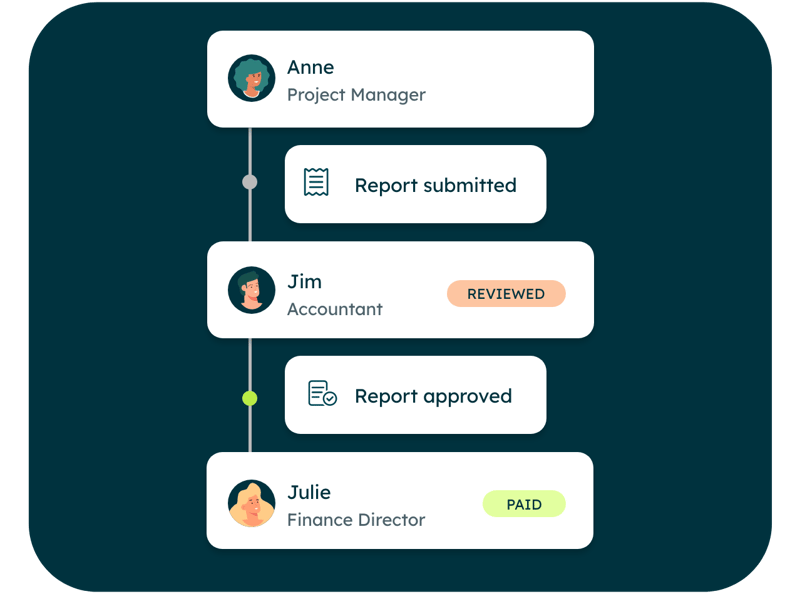
Save time with an optimised approval process
Track the progress of expense reports through various stages of approval and control. Identify bottlenecks or delays in the process.
Dive deeper than ever into data dimensions
Wouldn't it be great if you knew exactly where to look for irregularities from day one? Aggregate data by company, cost centre, project, user profile, custom expense categories and more.
Pinpoint specific areas where spending is concentrated.Identify departments with potential cost optimisation opportunities.
Navigate data hierarchies for granular insights across all entities, cost centres, and projects.
Safeguard confidential reports under tight lock and key
Your data is in good hands.
Ensure that your data remains confidential and compliant.
Control who has access to specific data by the entity or cost centre.
.png?width=1200&height=950&name=%5BMarkets%5D%20Local%20(ENG).png)
Make teamwork a dream
Tackle data siloes head-on. Insights offers users a single, collaborative reporting workspace shared by the entire team.
All users can:
View and work on the same report.
Create and share dashboards.
Copy and edit each other's reports.
Identify overspending with automated alerts
- Receive email alerts from detected excess spending.
- Identify top spenders, spending trends and irregularities across regions with interactive maps and visual cues.
- Improve forecasting and budgeting using seasonal data.
How can I start using Insights?
Unsure how it will suit your organisation’s needs?
Get in touch and we will help you to figure it out. Experience firsthand how Insights works in real-time during a demo.
Are you an existing client without Insights? Simply reach out to your dedicated account manager to explore how to activate Insights for your organisation.
.png?width=800&height=633&name=%5BSolution%5D%20C02%20reporting_exporting%20(ENG).png)
"The implementation of Mobilexpense was quick, we were up and running in no time."
Henrika Ahtela
Finance Systems and Process Manager
Take full control with all the tools in one place
Company cards are just one way to manage expenses. Imagine what you could do if you take full control all the way from travel expenses to integrations.

 The CFO handbook The most comprehensive guide for financial leaders who wish to streamline their team and business for the challenges of 2023.
The CFO handbook
The most comprehensive guide for financial leaders who wish to streamline their team and business for the challenges of 2023.

3 Step checklist to reduce business costs
Aaliquet rhoncus quam. Etiam eget dui in enim feugiat ultrices. Donec consequat tempor odio.

Updated VAT, Mileage and Allowance Rates for 2023
Aaliquet rhoncus quam. Etiam eget dui in enim feugiat ultrices. Donec consequat tempor odio.

Improve Expense Report Control With Automation
Aaliquet rhoncus quam. Etiam eget dui in enim feugiat ultrices. Donec consequat tempor odio.
"It's at least 90 to 95% less work for us now thanks to the card integration, compared to the previous paper and Excel process. I think I'm sending 95% less time on expenses. "
''Mobilexpense makes your life much easier, and makes doing your administrative tasks a lot more fun than in the past where it was more like a headache.''

"Mobilexpense had the most attractive offer for us. They provided the functionalities we were looking for and they were responsive to specific questions we had."

Ready to get started?
For insights into your expenses, talk to an expert
Get in touch with us to discuss your data insight requirements, take a look at our integrated reporting functions or have your questions answered.